Get started with WNBA API v8
Introduction
Sportradar is the Official Data Provider of WNBA data. We combine on-venue speed and detailed game and seasonal statistics to power your basketball experiences. All regular season games update in real-time, with live advanced metrics.
The WNBA API is consistent in structure, format, and behavior with our other League Specific APIs. Our primary feeds return schedules, standings, team and player data, and real-time scores.
Additional feeds provide a host of complementary statistics and information, including:
- Rankings
- League leaders
- Injuries
- Free agents
- Live advanced metrics
- In-game substitution info
- Live event positional data
Real-time customers are also offered three delivery Push Feeds to enhance speed.
Authentication is required for all API calls.
WNBA Integration Guide
Explore our WNBA API Integration Guide for detailed, step-by-step guidance on how to build applications using our WNBA API.
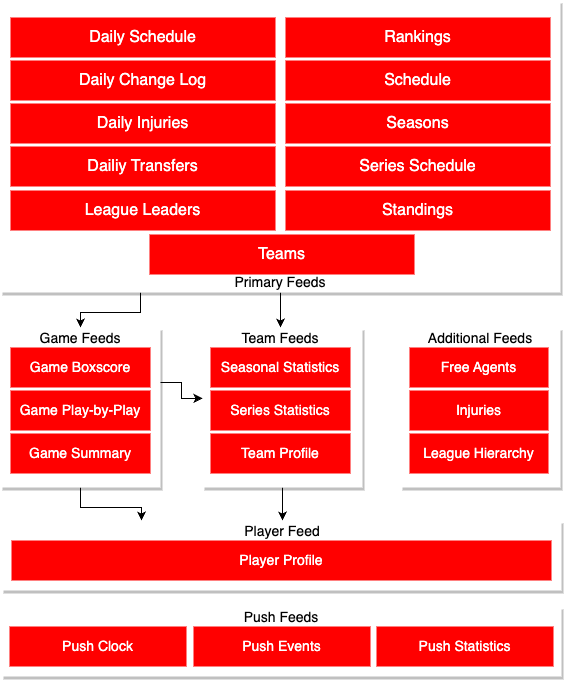
API Map
To best utilize the WNBA API, you will need several parameters to create your API calls. The map below illustrates how you can obtain the parameters you need.
The primary feeds require only a date or season to call the endpoints. Those feeds provide Game, Team, or Player Ids which can be used to generate the game, team, and player feeds. All of the other feeds require no variables.
Endpoint Descriptions
Daily Change Log – Provides IDs and timestamps for teams, players, game statistics, schedules, and standings that have been modified on a given date. To receive the data updates, use these unique IDs to pull relevant API feeds.
Daily Injuries – Provides details for all injuries updated on a given date.
Daily Schedule – Date, time, location, and other event details for every game taking place in the league-defined day.
Daily Transfers – Information for all transfers added or edited during the league-defined day.
Free Agents – Detailed player information for all current free agents in the league.
Game Boxscore – Top-level team scores by quarter, along with full statistics for each teams’ leaders in points, rebounds, and assists.
Game Play-by-Play – Detailed, real-time information on every team possession and game event.
Game Summary – Top-level boxscore information along with detailed game stats at the team and player levels.
Injuries – Information concerning all active player injuries for each WNBA team.
League Hierarchy – League, conference, division, and team identification and association information.
League Leaders – WNBA leader information for various offensive and defensive categories including full player seasonal statistics for each player in each category.
Player Profile – Provides player biographical information, draft information, and seasonal statistics.
Rankings – Conference and division rank for each team, including playoff clinching status.
Schedule – Date, time, location, and other event details for every match-up taking place in the full league season.
Seasonal Statistics – Provides complete team and player seasonal statistics for a given season and season type.
Seasons – Provides a list of all available seasons, including preseasons and postseasons.
Series Schedule – Playoff participant information as well as the date, time, location, and other event details for every match-up taking place for the entire playoffs.
Series Statistics – Detailed team and player statistics for a given playoff series.
Standings – Detailed team records across various views including, overall, conference, and division information.
Team Profile – Provides top-level team information and a full roster of active players.
Teams – Provides a complete list of active teams in the WNBA API database.
Push Clock – Game clock feed with high level scoring and possession information.
Push Events – Detailed, real-time information on every game event.
Push Statistics – Detailed, real-time game stats at the team and player level for all live games.
Data Retrieval Samples
To find a team's leader in assists for a given game:
- Call the season or series schedule and find the Game Id for the chosen game
- Call the Game Boxscore using the Game Id
- Find the Team Assists Leader statistics and locate the player full_name attribute
The name of the team's leader in assists is displayed.
To find a player's average points per game:
- Call the season or series schedule and find id for the team the player is on
- Call the Team Profile using the Team ID
- Locate the Player ID for your chosen player and call the Player Profile.
- Find the average element with the points attribute
The players's average points are displayed.
Coverage Levels
We provide two different levels of detail to ensure maximum coverage. We combine coverage levels with the correct feeds to ensure you are getting the most comprehensive data offering in the most efficient manner possible.
Full – We provide live play-by-play coverage for the entire game. We provide updated scores and time remaining as well as team and player level data in near real time. Full coverage is available for all regular and post-season games as well as those pre-season games available live via a broadcast.
Extended Boxscore – We provide scores, time remaining, and team leaders (assists, points, and rebounds), in a timely manner, as the game progresses. We provide team- and player-level data for the game within 30 minutes of the official results being posted. Extended Boxscore coverage is available for any pre-season game not available via a reliable broadcast.
Preseason Coverage Note:
Preseason coverage of WNBA games may vary. Some games may be extended boxscore coverage due to on-venue data-entry being unavailable.
API data latency will vary compared to regular season games. Preseason games often serve as a testing ground, resulting in changes and adjustments to data collection methods. As a result, data updates may not be as timely or consistent as the regular season.
Integration Links
Integration Guide
Set up an account, learn the WNBA API basics, study our game workflows, tackle in-depth integration scenarios, and more by visiting our WNBA v8 Integration Guide!
Postman Workspace

Our entire Media APIs are available on Postman. Click the link above to be taken directly to our WNBA API collection.
Feel free to follow and/or fork any collections to receive updates.
Schema Download
Open the zip file below to access our entire WNBA API XSD schema.
Simulations
Check out our Simulationsto replay actual games at any time, on your own schedule.
Failover Information
Reference the below files to find data points unavailable when Sportradar's data team provides game updates due to a WNBA data interruption. Please note that when the game is over, all data entered by Sportradar is deleted and replaced with the official data provided by the WNBA.
Commissioner's Cup
The WNBA Commissioner’s Cup is an in-season competition that runs concurrently with the regular season, designed to elevate competitive play and add excitement through a designated series of games that lead to a championship and cash prize.
At the start of the season, each team designates 10 of its regular season games—five home and five away—as Commissioner’s Cup games. These matchups are pre-selected based on conference rivals and count toward a special Cup standings table, separate from the overall league standings.
At the conclusion of Cup play, the top team from the Eastern Conference and the top team from the Western Conference in Cup standings qualify for the Commissioner’s Cup Championship Game. This single-game final determines the Cup winner.
While all Cup games are also regular season games, the Commissioner’s Cup Championship game is an extra 41st game for the two participating teams and does not count toward the regular season standings.
Season Types
A season type was created in the WNBA API for the WNBA In-Season Tournament called Commissioner's Cup with code (also referred to as parameter) of CC. This season type can be retrieved via the WNBA Seasons feed:
https://api.sportradar.com/wnba/production/v8/en/league/seasons.xml
  </season>
  <season id="44eeaa8a-7cd3-4153-abf6-32dc62098001" year="2024" start_date="2024-06-25" end_date="2024-06-26" status="scheduled">
    <type code="CC" name="Commissioner's Cup"/>
  </season>
This code (or parameter) can be used to retrieve endpoints for the following feeds:
- League Leaders
- Rankings
- Schedule
- Seasonal Statistics
- Series Schedule
- Standings
Tournament Schedule
All Commissioner's Cup games are part of the regular season (REG) schedule and are marked with a special attribute to identify them as cup games.
The regular season games included in the WNBA Commissioner's Cup will have a game attribute called cc_cup with a value of true.
<game id="765fac81-ca49-432b-8368-a419565a5531" status="scheduled" coverage="full" scheduled="2025-06-01T19:00:00Z" track_on_court="true" sr_id="sr:match:56327961" reference="1022500041" cc_cup="true" home_team="08ed8274-e29f-4248-bc2e-83cc8ed18d75" away_team="a015b02d-845c-40c1-8ef4-844984f47e4d">
        <time_zones venue="US/Eastern" home="US/Eastern" away="US/Eastern"/>
        <venue id="7a330bcd-ac0f-50ca-bc29-2460e5c476b3" name="Barclays Center" capacity="17732" address="620 Atlantic Avenue" city="Brooklyn" state="NY" zip="11217" country="USA" sr_id="sr:venue:36132">
          <location lat="40.682957" lng="-73.975165"/>
        </venue>
        <home name="New York Liberty" alias="NYL" id="08ed8274-e29f-4248-bc2e-83cc8ed18d75" sr_id="sr:team:3446">
        </home>
        <away name="Connecticut Sun" alias="CON" id="a015b02d-845c-40c1-8ef4-844984f47e4d" sr_id="sr:team:35547">
        </away>
Click here for XML and JSON samples of the Schedule feed with the cc_cup games included.
Commissioner's Cup Final Game
In the WNBA Commissioner’s Cup, the team with the best record in designated Cup games from each conference qualifies for the Commissioner’s Cup Championship Game. The team with the better overall record in those Cup games—regardless of conference—earns the right to host the final.
The Commissioner's Cup Final Game is scheduled under the CC season type, highlighting its status as a tournament final and not affecting regular season standings. Note the following examples.
Schedule feed http://api.sportradar.com/wnba/trial/v8/en/games/2023/CC/schedule.xml
Series Schedule feed http://api.sportradar.com/wnba/trial/v8/en/series/2023/CC/schedule.xml
<league xmlns="http://feed.elasticstats.com/schema/basketball/schedule-v8.0.xsd" id="59c24590-0adb-4b3d-80a8-10450f83f4a1" name="WNBA" alias="WNBA">
  <season-schedule id="5be64ff6-57bb-4d68-8881-78f8673eebd7" year="2023" type="CC">
    <games>
      <game id="0d64e6b7-c7ea-49e7-ae34-6ed9fc0e3aa4" status="closed" title="2023 Commissioner's Cup Final" coverage="full" scheduled="2023-08-16T01:00:00Z" home_points="63" away_points="82" parent_id="0a41e801-8179-4e66-b202-7daf10449241" track_on_court="true" reference="1052300001" cc_cup="true" home_team="171b097d-01db-4ae8-9d56-035689402ec6" away_team="08ed8274-e29f-4248-bc2e-83cc8ed18d75">
        <time_zones venue="US/Pacific" home="US/Pacific" away="US/Eastern"/>
        <venue id="06c2f947-3e69-43b8-bfec-d01c2370a21f" name="Michelob ULTRA Arena" capacity="12000" address="3950 Las Vegas Boulevard South" city="Paradise" state="NV" zip="89119" country="USA" sr_id="sr:venue:17989">
          <location lat="36.09061" lng="-115.178976"/>
        </venue>
        <home name="Las Vegas Aces" alias="LVA" id="171b097d-01db-4ae8-9d56-035689402ec6" sr_id="sr:team:35550">
        </home>
        <away name="New York Liberty" alias="NYL" id="08ed8274-e29f-4248-bc2e-83cc8ed18d75" sr_id="sr:team:3446">
        </away>
        <broadcasts>
          <broadcast network="Prime Video" type="TV" locale="National"/>
        </broadcasts>
      </game>
    </games>
  </season-schedule>
</league>
Standings
To access the Commissioner's Cup standings, you need use the CC season parameter. In the endpoint below, you will see teams placed in the Commissioner's Cup groups.
Please note that no Commissioner's Cup data will exist in regular seasason standings.
https://api.sportradar.us/wnba/production/v8/en/seasons/2023/CC/standings.xml
<league xmlns="http://feed.elasticstats.com/schema/basketball/wnba/standings-v3.0.xsd" id="59c24590-0adb-4b3d-80a8-10450f83f4a1" name="WNBA" alias="WNBA">
  <season id="5be64ff6-57bb-4d68-8881-78f8673eebd7" year="2023" type="CC">
    <conference id="092510cf-3285-48bb-b831-40ac3608ca36" name="EASTERN CONFERENCE" alias="EASTERN-W">
      <team id="08ed8274-e29f-4248-bc2e-83cc8ed18d75" name="Liberty" market="New York" wins="8" losses="3" win_pct="0.727" points_for="84.91" points_against="78.91" point_diff="6.0" sr_id="sr:team:3446">
        <games-behind league="1.0" conference="0.0"/>
        <streak>
          <win length="4"/>
        </streak>
        <calc_rank/>
        <records>
          <below_500 wins="3" losses="1" win_pct="0.75"/>
          <conference wins="7" losses="3" win_pct="0.7"/>
          <equal_rebounds wins="0" losses="0" win_pct="0.0"/>
          <equal_turnovers wins="0" losses="0" win_pct="0.0"/>
          <fewer_turnovers wins="3" losses="1" win_pct="0.75"/>
          <home wins="3" losses="2" win_pct="0.6"/>
          <last_10 wins="8" losses="2" win_pct="0.8"/>
          <last_10_home wins="3" losses="2" win_pct="0.6"/>
          <last_10_road wins="5" losses="1" win_pct="0.833"/>
          <leads_field_goal_pct wins="7" losses="0" win_pct="1.0"/>
          <leads_rebounds wins="5" losses="2" win_pct="0.714"/>
          <opponent_fewer_turnovers wins="5" losses="2" win_pct="0.714"/>
          <opponent_leads_field_goal_pct wins="1" losses="3" win_pct="0.25"/>
          <opponent_leads_rebounds wins="3" losses="1" win_pct="0.75"/>
          <opponent_scores_100_or_more wins="0" losses="0" win_pct="0.0"/>
          <over_500 wins="5" losses="2" win_pct="0.714"/>
          <overtime wins="2" losses="0" win_pct="1.0"/>
          <road wins="5" losses="1" win_pct="0.833"/>
          <scores_100_or_more wins="1" losses="0" win_pct="1.0"/>
          <ten_points wins="4" losses="1" win_pct="0.8"/>
          <three_points wins="2" losses="0" win_pct="1.0"/>
        </records>
      </team>
      <team id="a015b02d-845c-40c1-8ef4-844984f47e4d" name="Sun" market="Connecticut" wins="7" losses="3" win_pct="0.7" points_for="82.2" points_against="77.7" point_diff="4.5" sr_id="sr:team:35547">
        <games-behind league="1.5" conference="0.5"/>
        <streak>
          <win length="1"/>
        </streak>
Click here for XML and JSON samples of the CC Standings.
All-Star Game FAQ
How do I locate the WNBA All-Star game?
The game can be found in the Daily Schedule feed on the date of the event. For example: wnba/trial/v8/en/games/2024/07/20/schedule
Every game-centric feed (e.g. Game Play-by-Play, Game Summary, Push Events, etc) can be accessed during the game.
Click here for for a Game Summary or Play-by-Play sample of the 2023 game.
What are the differences from a typical WNBA game?
WNBA announced that 2024 would feature a matchup between the WNBA All-Stars who comprise the US Women's National Team versus the remaining WNBA All-Stars.
Please note that these teams will not be included in the League Hierarchy endpoint.
Is the All-Star game covered in realtime?
Yes. The game is covered in realtime, including the same level of team and player statistics as a regular season game.
When are the All-Star rosters set?
All-Star game rosters will be available shortly prior to tipoff.
Please note that we only provide game rosters (not team rosters) for each game. Request the Game Summary endpoint prior to the game to receive rosters.
If you require rosters earlier, we suggest using the Team Profile endpoints of each WNBA team to pull in players manually.
Do you cover any of the other All-Star game events?
No. We currently only cover the WNBA All-Star game in the WNBA API.