Standings and Rankings
Prerequisite - Accessing Available Seasons
To avoid confusion and ensure you're accessing available data, refer to our Seasons feed. This resource lists all the seasons for which we have data.
For example: To ensure data availability for future seasons, such as a schedule in advance of when a season begins, first check the Seasons feed to verify that data for that specific season is already provided.
Starting with this feed can prevent unnecessary errors and streamline your data retrieval process.
Starting Year for Each SeasonIt's important to note that the
seasonparameter uses the starting year of the season; for example, to retrieve data for the 2024-25 NBA season, you would use2024as the value for the season parameter.
Difference Between Standings and Rankings
In the NBA, standings and rankings are related but distinct concepts:
- Standings provide detailed team records that you can display in whichever format you prefer. It also provides a calculated standings division and conference rank.
- Rankings are used to determine teams’ rank in divisions, conferences, and playoff-clinching status. This endpoint is updated manually at the end of each night.
How to Access Standings
You can access standings using the Standings feed. This endpoint provides detailed team records across various views including, overall, conference, and division information.
Recommended Call Frequency:
- Standings are updated on a two-minute timer after each game is moved to
completestatus. - Pull every hour or less, depending on your use case.
- Pull 2-5 mins after a game is moved to 'complete' to receive the quickest updates.
Analyzing Standings Data
{
  "id": "583ecf50-fb46-11e1-82cb-f4ce4684ea4c",
  "name": "Mavericks",
  "market": "Dallas",
  "wins": 50,
  "losses": 32,
  "win_pct": 0.61,
  "points_for": 117.85,
  "points_against": 115.65,
  "point_diff": 2.21,
  "sr_id": "sr:team:3411",
  "reference": "1610612742",
  "games_behind": {
    "league": 14,
    "conference": 7,
    "division": 0
  },
  "streak": {
    "kind": "loss",
    "length": 2
  },
  "calc_rank": {
    "div_rank": 1,
    "conf_rank": 5
  },
  "records": [
    {
      "record_type": "atlantic",
      "wins": 6,
      "losses": 4,
      "win_pct": 0.6
    },
    {
      "record_type": "below_500",
      "wins": 27,
      "losses": 8,
      "win_pct": 0.771
    },
    {
      "record_type": "central",
      "wins": 3,
      "losses": 7,
      "win_pct": 0.3
    },
    {
      "record_type": "conference",
      "wins": 31,
      "losses": 21,
      "win_pct": 0.596
    },
    {
      "record_type": "division",
      "wins": 11,
      "losses": 5,
      "win_pct": 0.688
    },
    {
      "record_type": "equal_rebounds",
      "wins": 1,
      "losses": 1,
      "win_pct": 0.5
    },
    {
      "record_type": "equal_turnovers",
      "wins": 3,
      "losses": 2,
      "win_pct": 0.6
    },
    {
      "record_type": "fewer_turnovers",
      "wins": 30,
      "losses": 15,
      "win_pct": 0.667
    },
    {
      "record_type": "home",
      "wins": 25,
      "losses": 16,
      "win_pct": 0.61
    },
    {
      "record_type": "last_10",
      "wins": 7,
      "losses": 3,
      "win_pct": 0.7
    },
    {
      "record_type": "last_10_home",
      "wins": 7,
      "losses": 3,
      "win_pct": 0.7
    },
    {
      "record_type": "last_10_road",
      "wins": 7,
      "losses": 3,
      "win_pct": 0.7
    },
    {
      "record_type": "leads_field_goal_pct",
      "wins": 37,
      "losses": 3,
      "win_pct": 0.925
    },
    {
      "record_type": "leads_rebounds",
      "wins": 22,
      "losses": 8,
      "win_pct": 0.733
    },
    {
      "record_type": "neutral",
      "wins": 0,
      "losses": 0,
      "win_pct": 0
    },
    {
      "record_type": "northwest",
      "wins": 10,
      "losses": 9,
      "win_pct": 0.526
    },
    {
      "record_type": "opponent_fewer_turnovers",
      "wins": 17,
      "losses": 15,
      "win_pct": 0.531
    },
    {
      "record_type": "opponent_leads_field_goal_pct",
      "wins": 13,
      "losses": 29,
      "win_pct": 0.31
    },
    {
      "record_type": "opponent_leads_rebounds",
      "wins": 27,
      "losses": 23,
      "win_pct": 0.54
    },
    {
      "record_type": "opponent_scores_100_or_more",
      "wins": 41,
      "losses": 32,
      "win_pct": 0.562
    },
    {
      "record_type": "overtime",
      "wins": 1,
      "losses": 0,
      "win_pct": 1
    },
    {
      "record_type": "over_500",
      "wins": 23,
      "losses": 24,
      "win_pct": 0.489
    },
    {
      "record_type": "pacific",
      "wins": 10,
      "losses": 7,
      "win_pct": 0.588
    },
    {
      "record_type": "road",
      "wins": 25,
      "losses": 16,
      "win_pct": 0.61
    },
    {
      "record_type": "scores_100_or_more",
      "wins": 50,
      "losses": 25,
      "win_pct": 0.667
    },
    {
      "record_type": "southeast",
      "wins": 10,
      "losses": 0,
      "win_pct": 1
    },
    {
      "record_type": "southwest",
      "wins": 11,
      "losses": 5,
      "win_pct": 0.688
    },
    {
      "record_type": "ten_points",
      "wins": 31,
      "losses": 21,
      "win_pct": 0.596
    },
    {
      "record_type": "three_points",
      "wins": 5,
      "losses": 2,
      "win_pct": 0.714
    }
  ]
}
Here's a breakdown of key standings components for the Dallas Mavericks, helping to understand how they perform across different contexts and how they rank within the league:
-
Team Data
-
Each team has an ID, name, market, and key statistics:
-
Record (Wins, Losses): The Dallas Mavericks have 50 wins and 32 losses, showing their overall performance for the season.
-
Winning Percentage (win_pct): The Mavericks have a win percentage of 0.61 (61%), critical for ranking within the standings.
-
Points For and Against: The Mavericks score an average of 117.85 points per game while allowing 115.65 points, leading to a point differential of +2.21. This is useful for gauging offensive and defensive effectiveness.
-
Games Behind: The Mavericks are 7 games behind in the conference and 0 games behind in their division, meaning they lead their division but trail in the broader conference.
-
Streaks: The Mavericks are currently on a 2-game losing streak, indicating recent performance struggles.
-
Rank: They are ranked 1st in their division and 5th in the Western Conference, reflecting their relative performance among other teams.
-
-
-
Categories: The
record_typein the Mavericks’ records breaks down performance into different game contexts. Each category represents a specific setting or opponent grouping.-
Division
- Performance against teams in their division (Southwest): The Mavericks have 11 wins and 5 losses against division opponents, which is crucial for division rankings and playoff seeding.
-
Conference
- Performance against all teams in the Western Conference: With 31 wins and 21 losses, this impacts their conference standing and playoff positioning.
-
Home and Road
-
Home: The Mavericks have a 25-16 record at home, showing their performance in Dallas.
-
Road: Their road record is also 25-16, reflecting consistent performance away from home.
-
-
Other Specifics
-
Win percentage (win_pct) within these categories provides a snapshot of their effectiveness in different scenarios, like against under .500 teams (0.771 win_pct) or in games where they lead in field goal percentage (0.925 win_pct).
-
Points for and against in each category help measure their offensive and defensive performance in different settings.
-
-
-
Strength Metrics:
- Point Differential: The +2.21 point differential indicates the Mavericks score slightly more than they allow, which is a positive metric when evaluating team strength in both offense and defense.
These components give a comprehensive view of how the Mavericks perform across various contexts, helping assess their strengths, weaknesses, and playoff readiness.
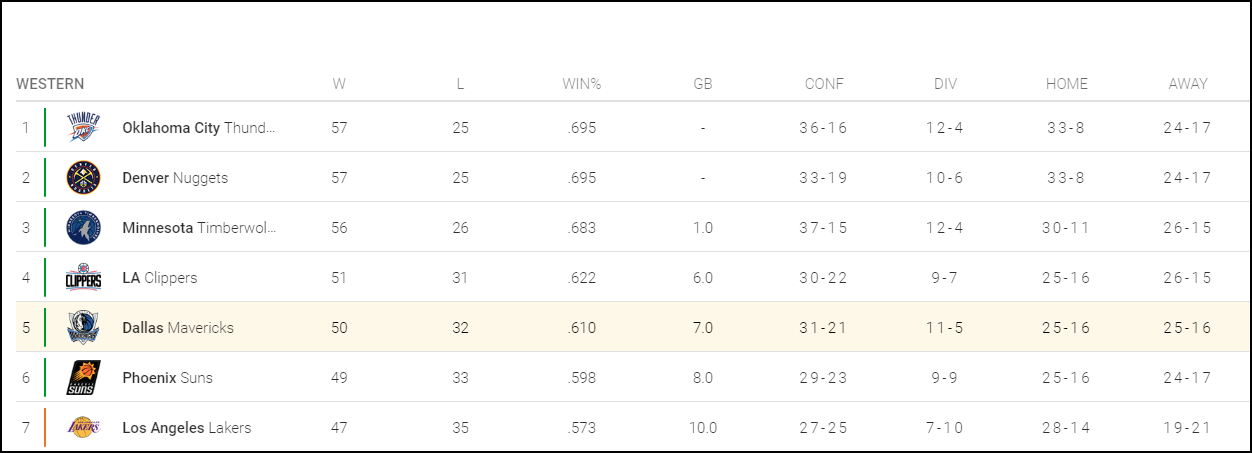
You might consider displaying NBA season standings data like the following to provide users with a comprehensive overview of team performances. It shows detailed statistics including wins, losses, home and road records, and points for and against.
In-Season Tournament Standings
The NBA In-Season Tournament is a mid-season competition where teams compete in a series of group-stage and knockout games, with the goal of winning the tournament's championship and a special prize.
To access the In-Season Tournament standings, you need use the IST season parameter. In the endpoint below, you will see teams placed in the In-Season Tournament groups.
Please note that no In-Season Tournament data will exist in regular season standings.
https://api.sportradar.us/nba/production/v8/en/seasons/2023/IST/standings.xml
<league
	xmlns="http://feed.elasticstats.com/schema/basketball/nba/standings-v4.0.xsd" id="4353138d-4c22-4396-
95d8-5f587d2df25c" name="NBA" alias="NBA">
	<season id="170cfa7b-54e8-468b-ab9f-21244769bd75" year="2023" type="IST">
		<conference id="02e1f608-b72d-484c-9fb3-c9df903bc54d" name="EASTERN CONFERENCE" alias="EASTERNIST">
			<division id="34643105-9549-4682-9801-fc72fb4880c4" name="East Group A" alias="EAST_GROUP_A">
				<team id="583ecb8f-fb46-11e1-82cb-f4ce4684ea4c" name="Hawks" market="Atlanta" wins="0" losses="0"
win_pct="0.0" points_for="0.0" points_against="0.0" point_diff="0.0" sr_id="sr:team:3423" reference="1610612737">
					<games-behind league="0.0" conference="0.0" division="0.0"/>
					<streak></streak>
					<calc_rank/>
					<records></records>
				</team>
				<team id="583ec773-fb46-11e1-82cb-f4ce4684ea4c" name="Cavaliers" market="Cleveland" wins="0"
losses="0" win_pct="0.0" points_for="0.0" points_against="0.0" point_diff="0.0" sr_id="sr:team:3432"
reference="1610612739">
					<games-behind league="0.0" conference="0.0" division="0.0"/>
					<streak></streak>
					<calc_rank/>
					<records></records>
				</team>
				<team id="583ec928-fb46-11e1-82cb-f4ce4684ea4c" name="Pistons" market="Detroit" wins="0" losses="0"
win_pct="0.0" points_for="0.0" points_against="0.0" point_diff="0.0" sr_id="sr:team:3424" reference="1610612765">
					<games-behind league="0.0" conference="0.0" division="0.0"/>
					<streak></streak>
					<calc_rank/>
					<records></records>
				</team>
				<team id="583ec7cd-fb46-11e1-82cb-f4ce4684ea4c" name="Pacers" market="Indiana" wins="0" losses="0"
win_pct="0.0" points_for="0.0" points_against="0.0" point_diff="0.0" sr_id="sr:team:3419" reference="1610612754">
					<games-behind league="0.0" conference="0.0" division="0.0"/>
					<streak></streak>
					<calc_rank/>
					<records></records>
				</team>
				<team id="583ec87d-fb46-11e1-82cb-f4ce4684ea4c" name="76ers" market="Philadelphia" wins="0"
losses="0" win_pct="0.0" points_for="0.0" points_against="0.0" point_diff="0.0" sr_id="sr:team:3420"
reference="1610612755">
					<games-behind league="0.0" conference="0.0" division="0.0"/>
<streak></streak>How to Access Rankings
You can access standings using the Rankings feed. This endpoint provides the conference and division rank for each team, including playoff clinching status.
Recommended Call Frequency:
- Rankings are updated at the end of the day during the regular season.
- Pull as necessary, depending on your use case.
What is Clinching Status?Clinching status refers to the point in the season when a team has secured a specific outcome, such as qualifying for the playoffs, winning their division, or securing home-court advantage.
Click here for a complete list of
clinchedvalues and their definitions.
{
  "id": "1d29f94c-9587-494b-a232-feb20a40eb4c",
  "name": "Southwest",
  "alias": "SOUTHWEST",
  "teams": [
    {
      "id": "583ecf50-fb46-11e1-82cb-f4ce4684ea4c",
      "name": "Mavericks",
      "market": "Dallas",
      "sr_id": "sr:team:3411",
      "reference": "1610612742",
      "rank": {
        "conference": 5,
        "division": 1,
        "clinched": "division"
      }
    },
    {
      "id": "583ecc9a-fb46-11e1-82cb-f4ce4684ea4c",
      "name": "Pelicans",
      "market": "New Orleans",
      "sr_id": "sr:team:5539",
      "reference": "1610612740",
      "rank": {
        "conference": 8,
        "division": 2
      }
    },
    {
      "id": "583ecb3a-fb46-11e1-82cb-f4ce4684ea4c",
      "name": "Rockets",
      "market": "Houston",
      "sr_id": "sr:team:3412",
      "reference": "1610612745",
      "rank": {
        "conference": 11,
        "division": 3,
        "clinched": "eliminated"
      }
    }
  ]
}
Here’s an analysis of the NBA Rankings feed, which gives a snapshot of teams’ positions within their division and conference, along with their clinching status:
-
Team Data
-
Each team has an ID, name, market, and key ranking data within both their conference and division.
-
Conference Rank: Shows where a team stands compared to all other teams in their conference. For example, the Dallas Mavericks are ranked 5th in the Western Conference, while the New Orleans Pelicans are 8th.
-
Division Rank: Indicates the team's position within its own division. For instance, the Mavericks are ranked 1st in the Southwest Division, while the Pelicans are 2nd.
-
Clinching Status: Reflects whether the team has secured a certain position or outcome for the season. The Mavericks have clinched their division, meaning they’ve secured the best record in the Southwest Division, while the Houston Rockets are eliminated, meaning they can no longer qualify for the playoffs.
-
-
-
Ranking Hierarchy
-
Teams are ranked in two primary categories:
- Division Ranking: Measures the team’s performance compared to others in the same division, which impacts their potential seeding in the playoffs.
- Conference Ranking: This is a broader ranking of all teams within a conference and plays a critical role in determining playoff seeding and home-court advantage.
-
-
Clinching Status and Its Importance:
-
Clinched Division: The Mavericks have clinched their division, meaning no other team in their division can surpass their record, guaranteeing them a higher seeding in the playoffs.
-
Eliminated: The Rockets are eliminated, meaning they can no longer qualify for the playoffs, which ends their postseason hopes for the year.
-
Monitoring Standings and Rankings with the Daily Change Log
The Daily Change Log can be a helpful tool for tracking potential adjustments to standings and rankings within the NBA (though rare). For example, if a game statistic is revised due to a correction or a late reporting of results, the change log will include an entry for the update in its results node.
Steps:
-
Identify Change Type: When you encounter an ID within the results node, it signifies that some data associated with the game has been updated. This doesn't necessarily mean the final score has changed, but rather that various game-related details have been modified.
-
Pull Detailed Data: Use the game IDs to pull information from the Postgame Standings and Rankings feeds.
-
Verify Changes: After pulling the detailed data from the Postgame Standings and Rankings feeds, compare the newly retrieved data against previously stored data to verify changes to the standings and update your records accordingly.
Note: While standings and rankings data typically remains stable once games are concluded and results are recorded, rare changes can still occur, such as adjustments following a review of play outcomes or corrections of data errors. You can continue monitoring the Daily Change Log to catch any updates that could impact standings, even though such adjustments are infrequent.
Updated 5 months ago